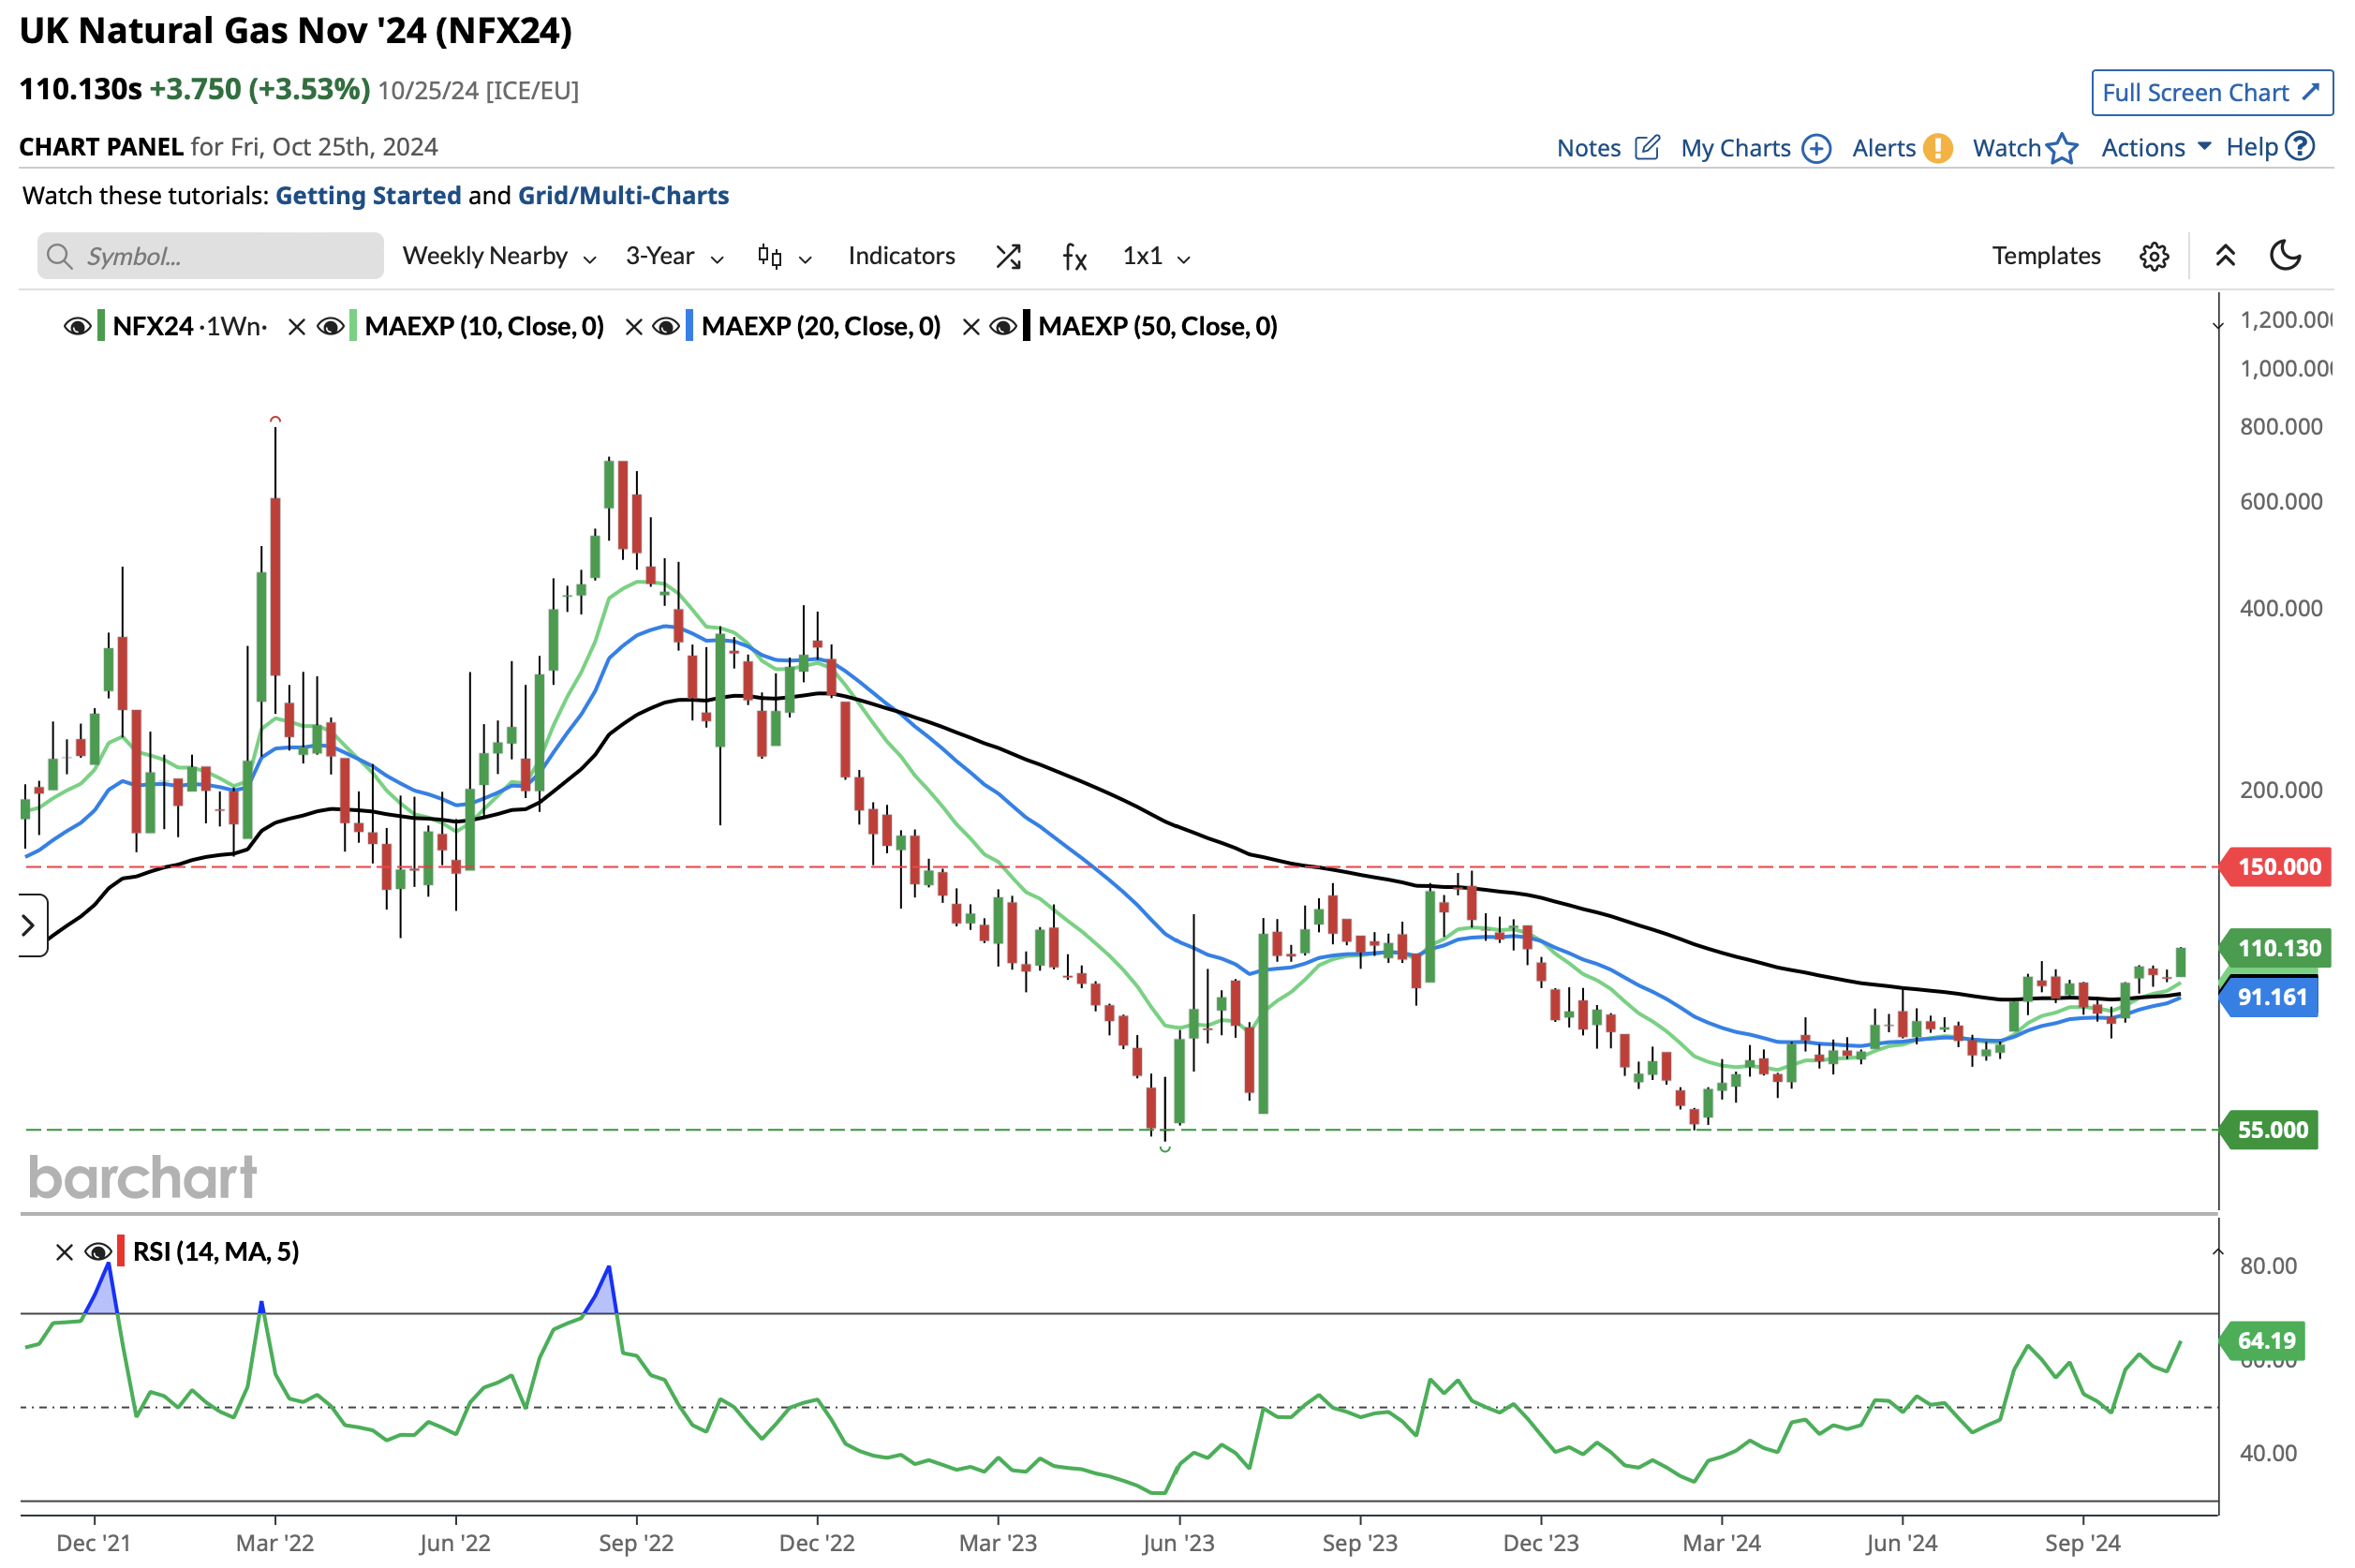
Energy Leads Weekly European Commodity Winners. UK natural gas (NFX24) surged +12.39% last week, topping European commodity winners. UK gas production is down 13% compared to last year, and a further 10% reduction is expected this year. Currently, production covers only 60% of demand. Reports indicate the North Sea basin output is declining rapidly. The UK’s total annual gas output is now close to the lowest in 15 years. The weekly chart shows a bullish signal with prices above the 10, 20, and 50-unit exponential moving averages (EMAs), with recent bullish crossings. The weekly Relative Strength Index (RSI) is at 64, approaching the 70 “overbought” area. Triple natural gas flare burning at night by Kirsten Strickland via iStock.
European commodities have seen a surge in oil and gas prices, with crude oil WTI ICE (WIZ24) experiencing a significant 4.5% increase. Traders are advised to use the 10 EMA as a support level, with stop losses to be activated if the level is broken down. The current trade is locked in a range, with support at 67.50-68 and resistance at 77.50. An attack on Iran’s oil facilities or an unexpected OPEC+ cut could potentially drive prices higher, making the risk to the upside higher than to the downside in the current context.

In contrast, nickel prices have cooled down.

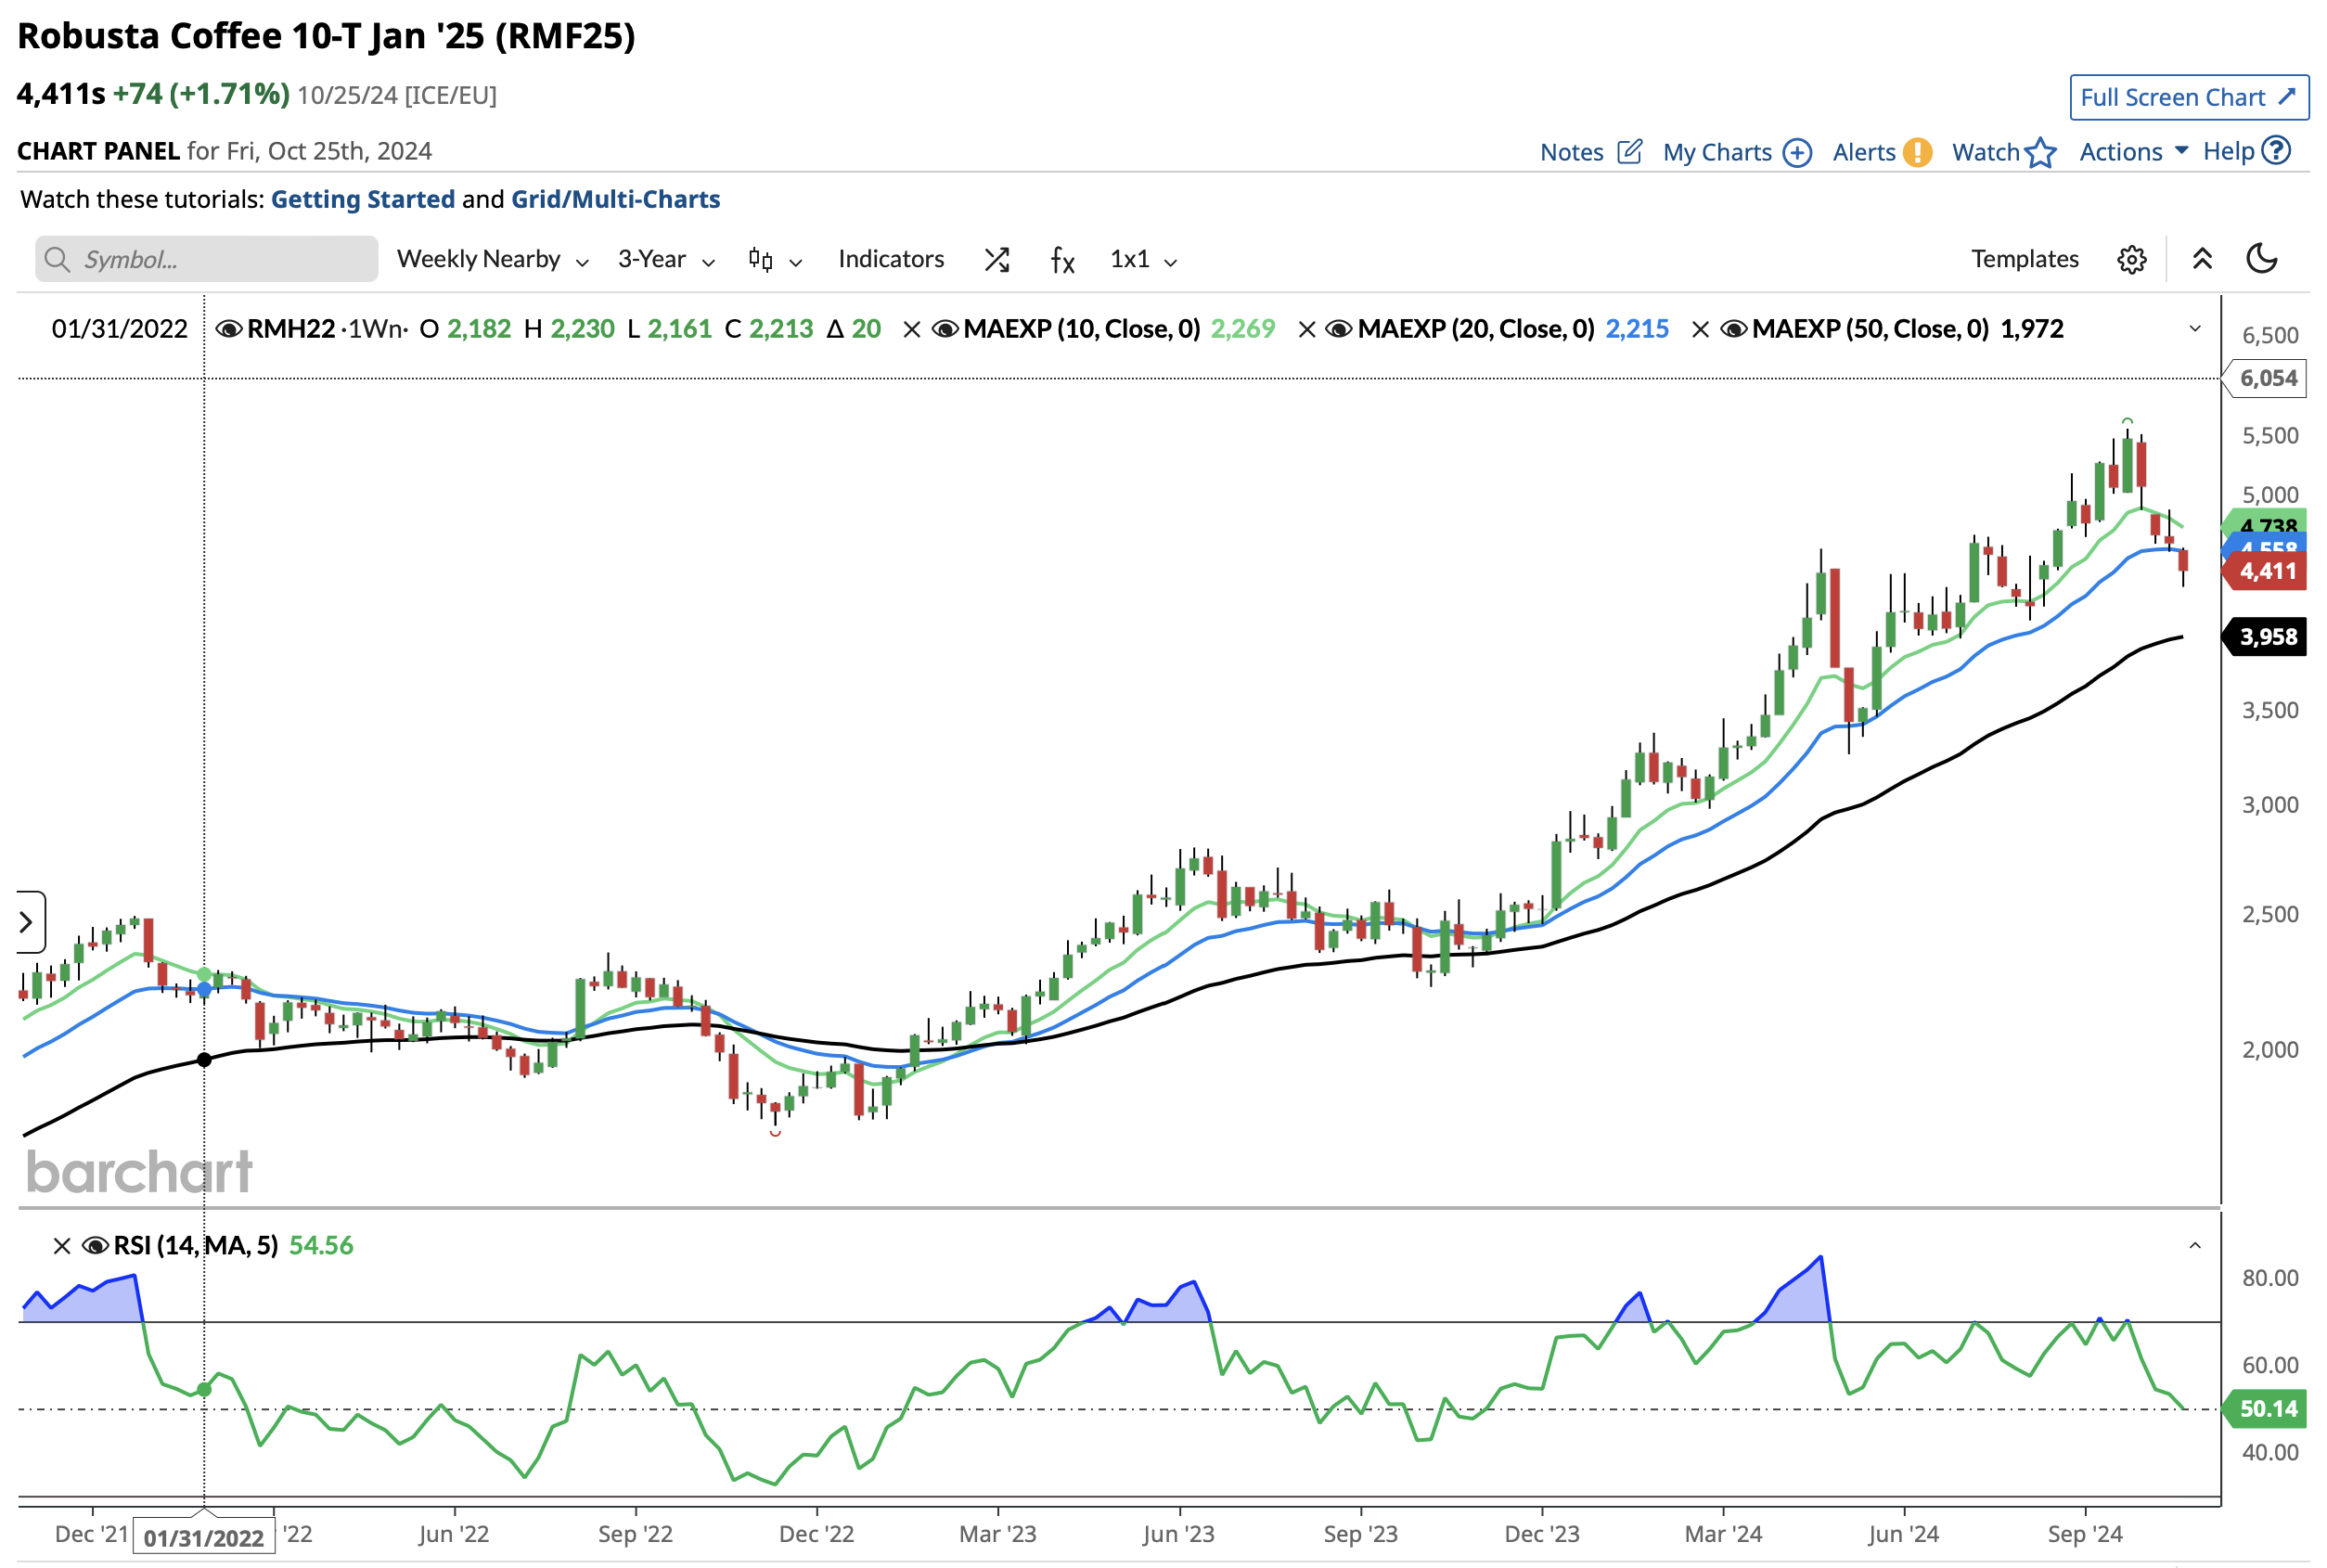
Last week, European commodity losers included robusta coffee 10-T (RMF25), which dropped by 4.42%. Some traders anticipate a 10% decrease in the coffee crop in Vietnam, the top global producer of robusta, contributing to 40% of the global output. This season began this month, and the expected reduction in yield could impact prices.
Drought conditions will affect production, marking the lowest in a decade. Some estimates are less pessimistic. Fundamentally, the market remains in deficit. Technically, there is a continuation of profit-taking and fund liquidation. Last week, I wrote: ‘Weekly prices have broken down the 10 and 20 EMAs in the last 3 weeks. The last 4 candles are in red and even show a bearish gap from 4 weeks ago. If the weekly current candle remains below the 20 EMA this week, this will encourage further short selling.’ This is what happened last week, with the candle trading well below the 10 and 20 EMAs. Watch out for the next target, the 50-week EMA at 3,958, which could prove a key support. The weekly RSI is at 50, neutral and can go further down. Nickel 3M Cash (P8Y00), -4.
LME inventories show ample supply now. 32% of LME inventories had 135,522tn as of Oct. 25. One year ago, it was around 42,000 tn. LME Funds Net Positions were deeply shorted around -16,000 contracts last month. But as of Oct. 20, they are back in positive territory at +16,373. Sometimes, this is a reliable leading indicator of trend changes. The relevant contract was down over 4% last week and continues to decline. It was mentioned last week that this metal is looking for a bottom at 15,900, and this remains a key level to watch. Breaking it down for over a week will send very bearish signals to the market. Long traders will be very active at this level as statistically it represents a tough support to break. Cocoa #7 (CAH25) is down 4.08%. We are seeing the lowest price levels since March. Fundamental data shows better conditions in West Africa.
Ivory Coast reports a significant 13% increase in port volume compared to the same time last year. Additionally, there are better output estimates for the next crop from Ivory Coast, up 10%. Technically, since the massive climb started in April 2024, prices have been in a zig-zag channel pattern with record volatility. Current prices are attempting to break the lower end of this pattern. If they remain below 4,800, the chances look better for short positions.


